BioMedli / Healthcare / AI
Health history, with the uncertainty left visible
Designing an AI-assisted path from scattered lab reports to reviewable values, trends and plain-language context.
- Sector
- Healthcare / AI
- Contribution
- Designer + Builder
- Services
- Product strategy · UX and interface design · AI interaction design · Design and build
- Period
- 2026

The brief
People had years of reports, but no dependable way to review extracted values, compare change or understand what the system could not know.
DUKU shaped the product model, report workflow, extraction review, biomarker timeline, explanation patterns and implementation from concept through deployment.
01 / Trust context
A clear answer begins with a reviewable record
Lab reports arrive as PDFs, scans and photographs created by different providers. They contain useful measurements, but the format is designed for a single encounter rather than a person trying to understand change across years.
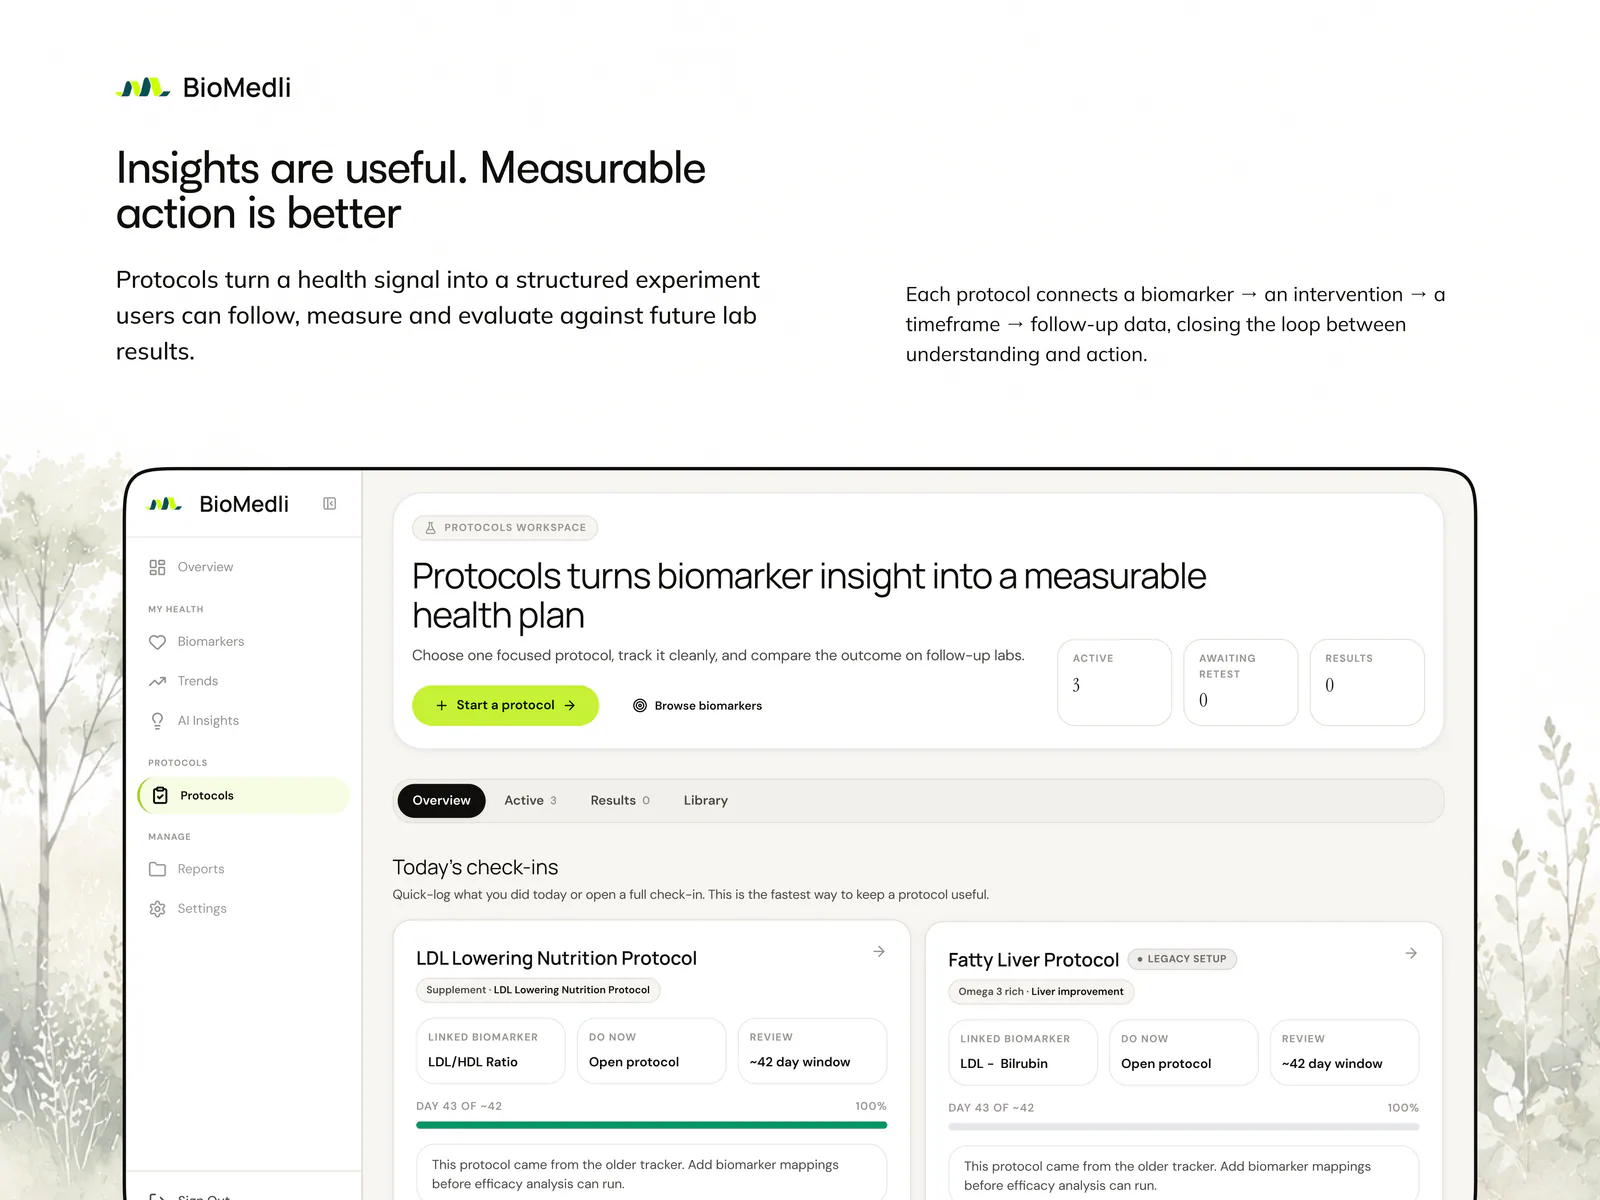
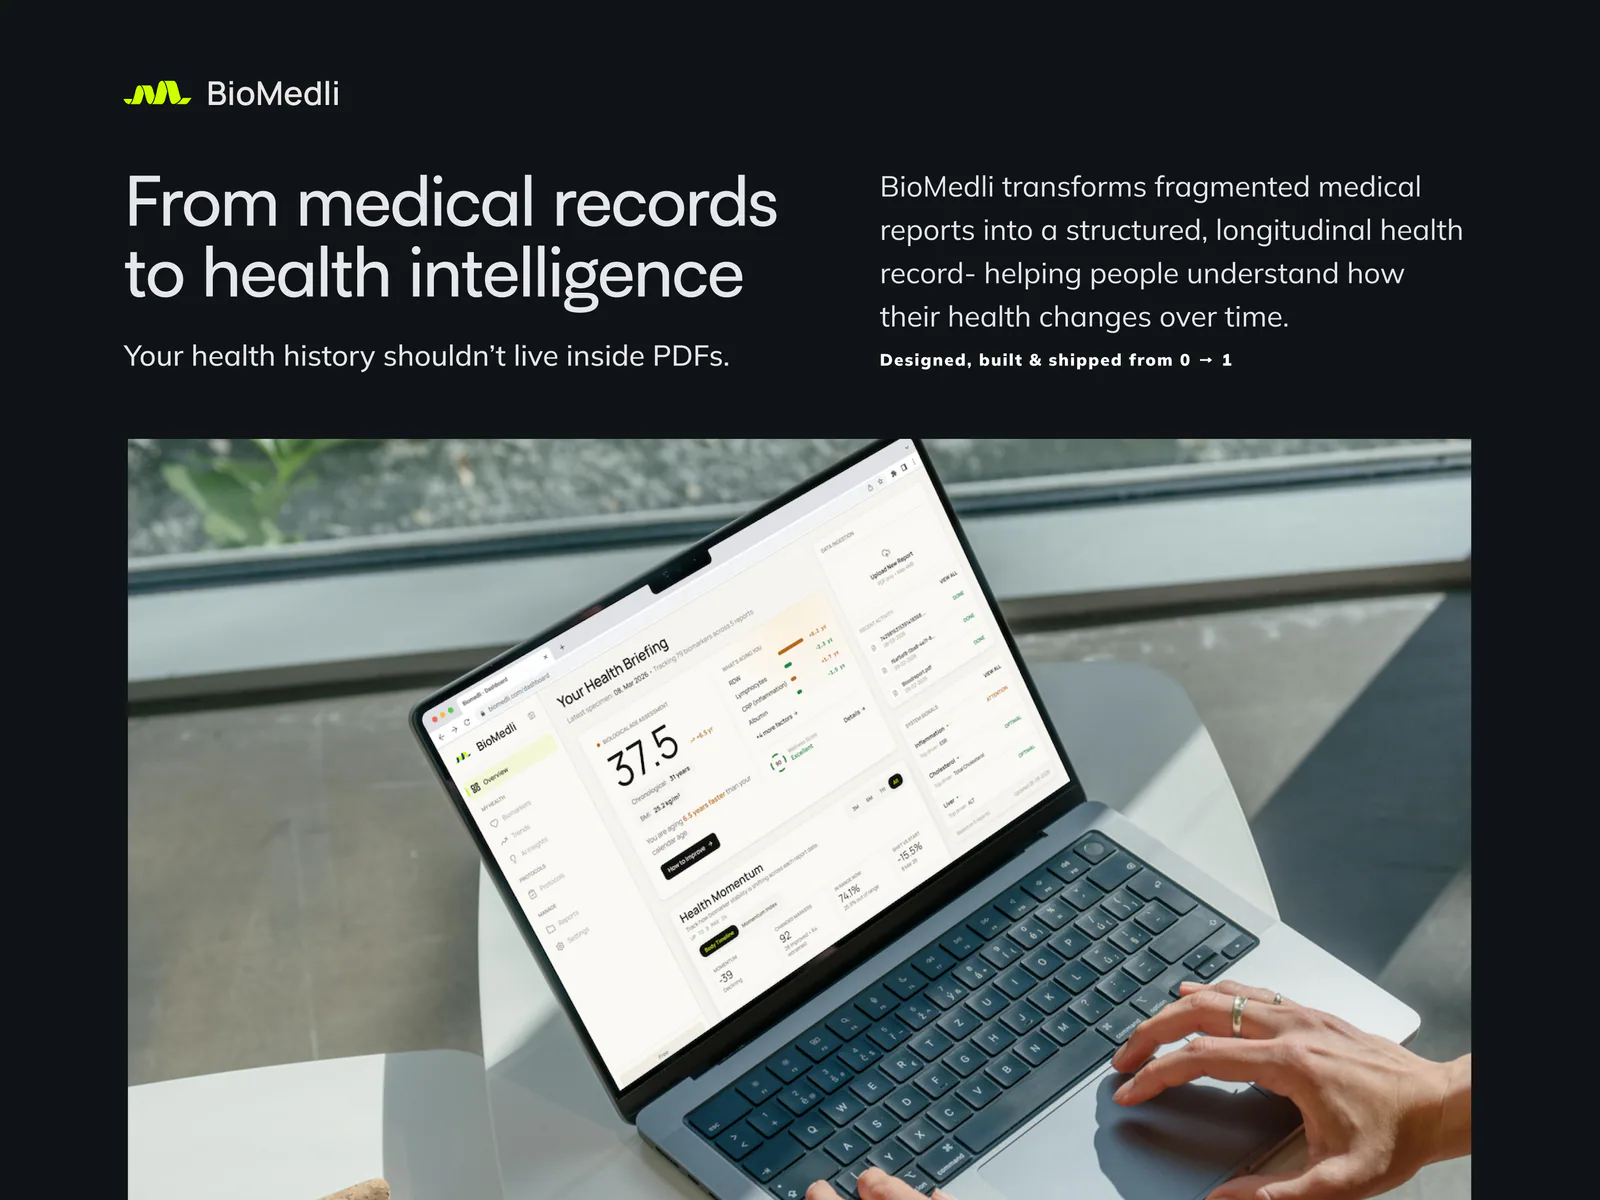
BioMedli reframes that archive as a longitudinal experience. The product does not begin with an open-ended chatbot. It begins by helping someone bring in a report, inspect what was extracted and establish a record they can control.
02 / Report ingestion
Make the file state as legible as the health state
Uploading a report can involve uncertain file quality, unsupported formats, multiple pages or content that is not a medical report at all. The workflow explains what was received, what is being processed and what needs attention without making the user interpret a technical pipeline.
Each file keeps its identity through upload, processing and review. If processing cannot continue, the product gives a specific recovery path rather than leaving someone with a generic failure.
From report to understanding
Upload
Accept the report and make file state, privacy context and progress visible.
Extract
Identify measurements and preserve the source relationship for later review.
Review
Let the person correct or reject uncertain values before they enter the timeline.
Understand
Place verified values in time with ranges, trends and bounded explanations.
03 / Extraction review
AI proposes; the person confirms
Extraction is treated as a draft, not invisible truth. The review experience keeps the measured value, unit, reference range and report date together. Low-confidence or conflicting fields are made visibly different so a person can focus attention where it matters.
Corrections are ordinary product behaviour, not an exceptional failure state. That framing supports trust because it makes the system’s role explicit and keeps the user in control of what becomes part of their health history.
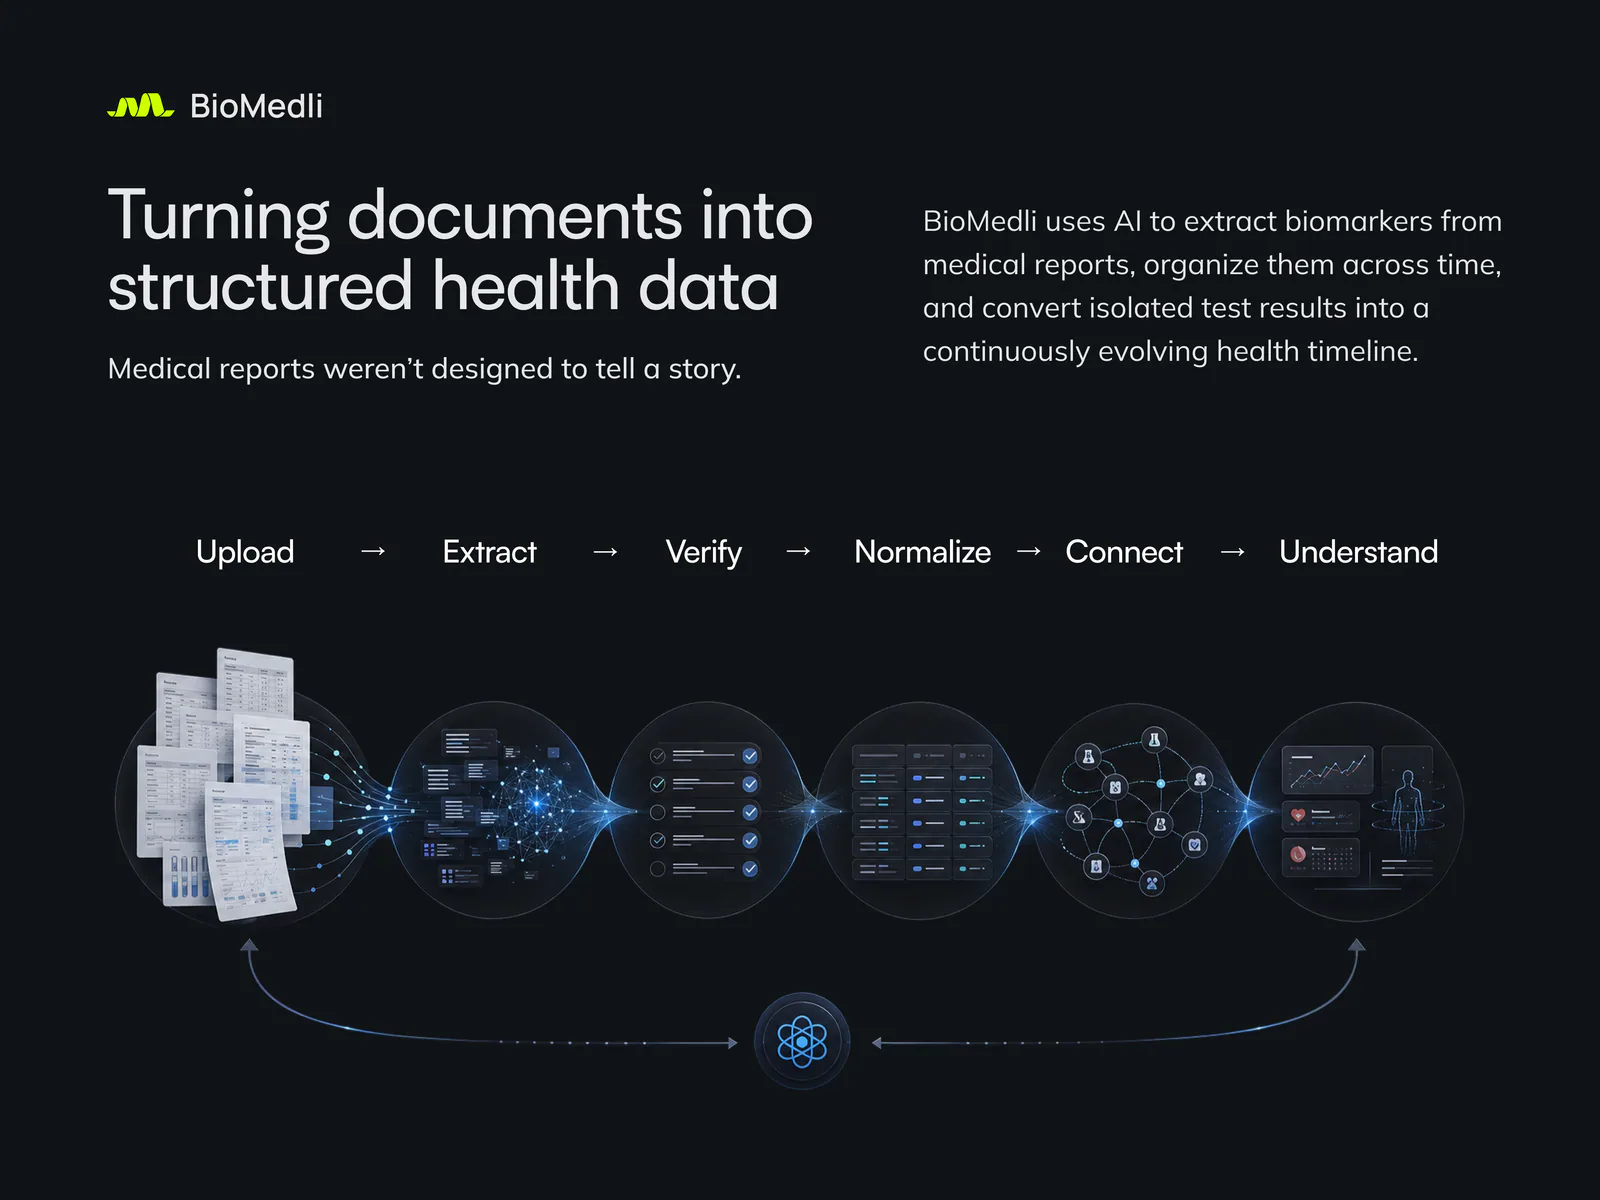
The extraction flow keeps source, value, unit and review status connected.
- Source relationship
A value remains traceable to the report it came from.
- Review state
Uncertain fields ask for attention before becoming timeline data.
- Correction path
People can edit a value without restarting the upload.
04 / Health timeline
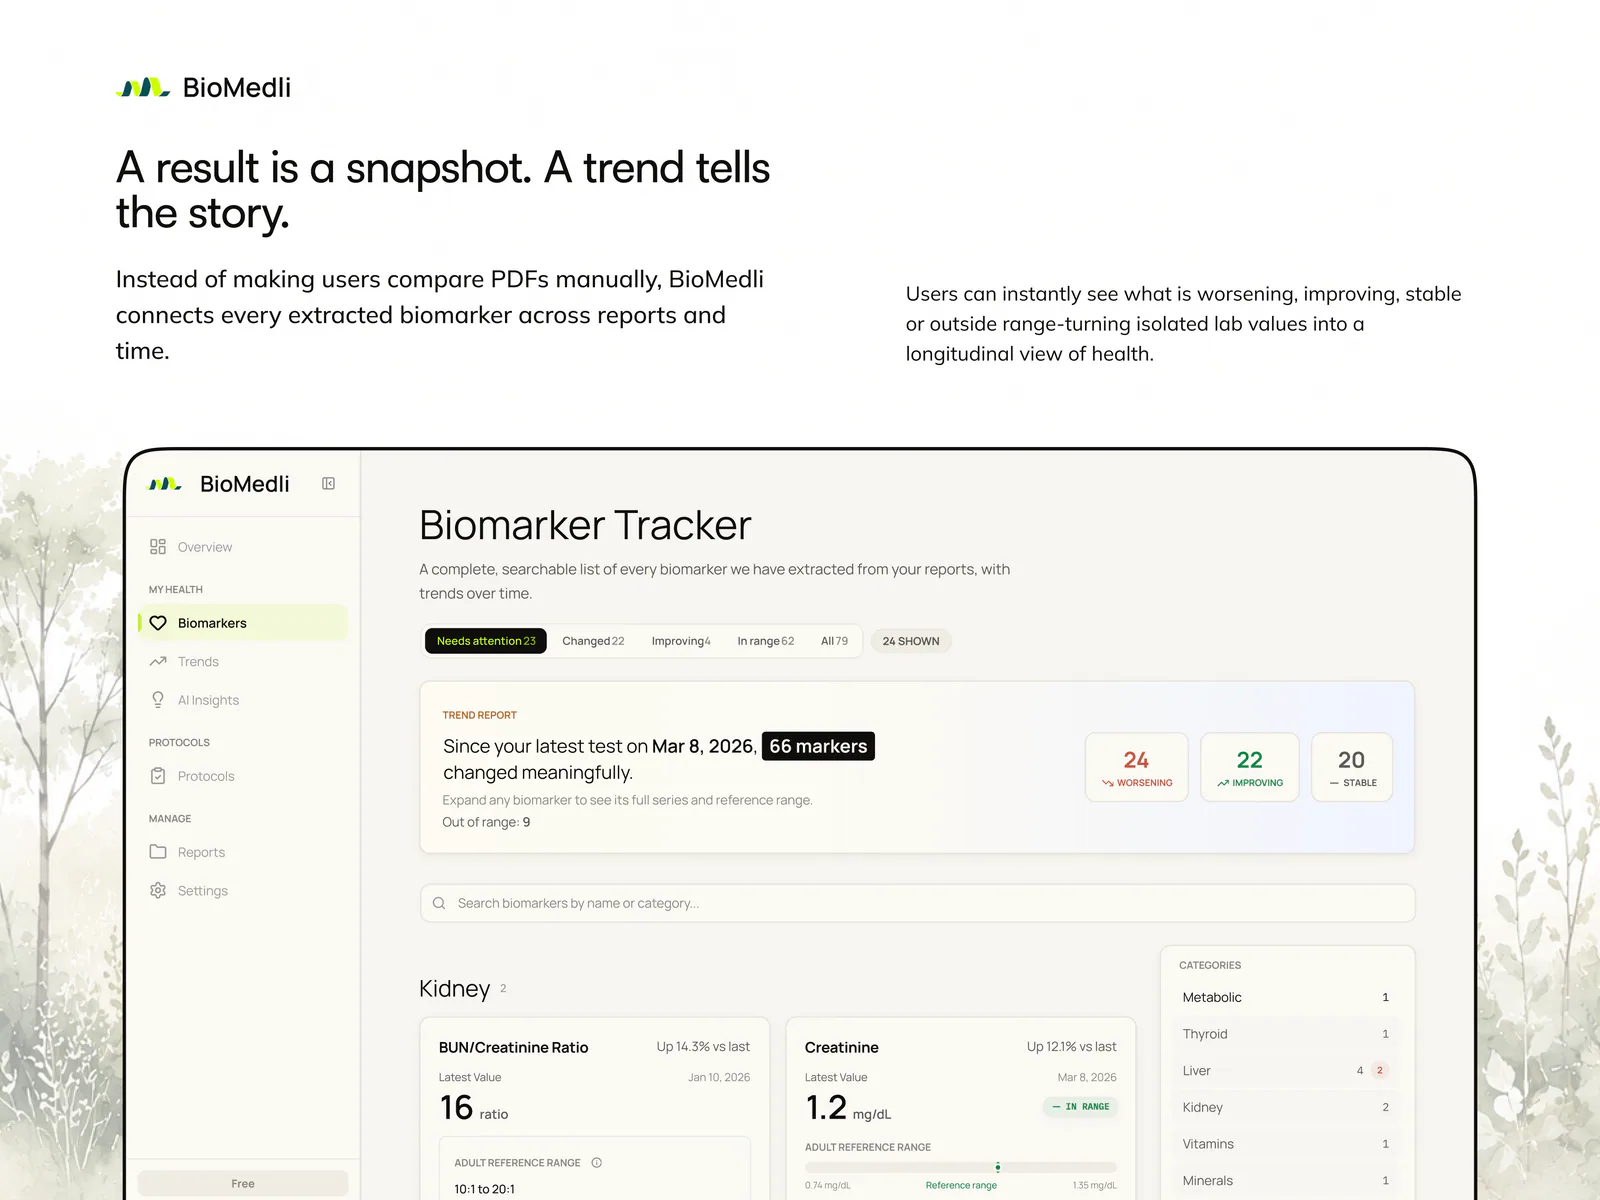
A timeline instead of another folder of reports
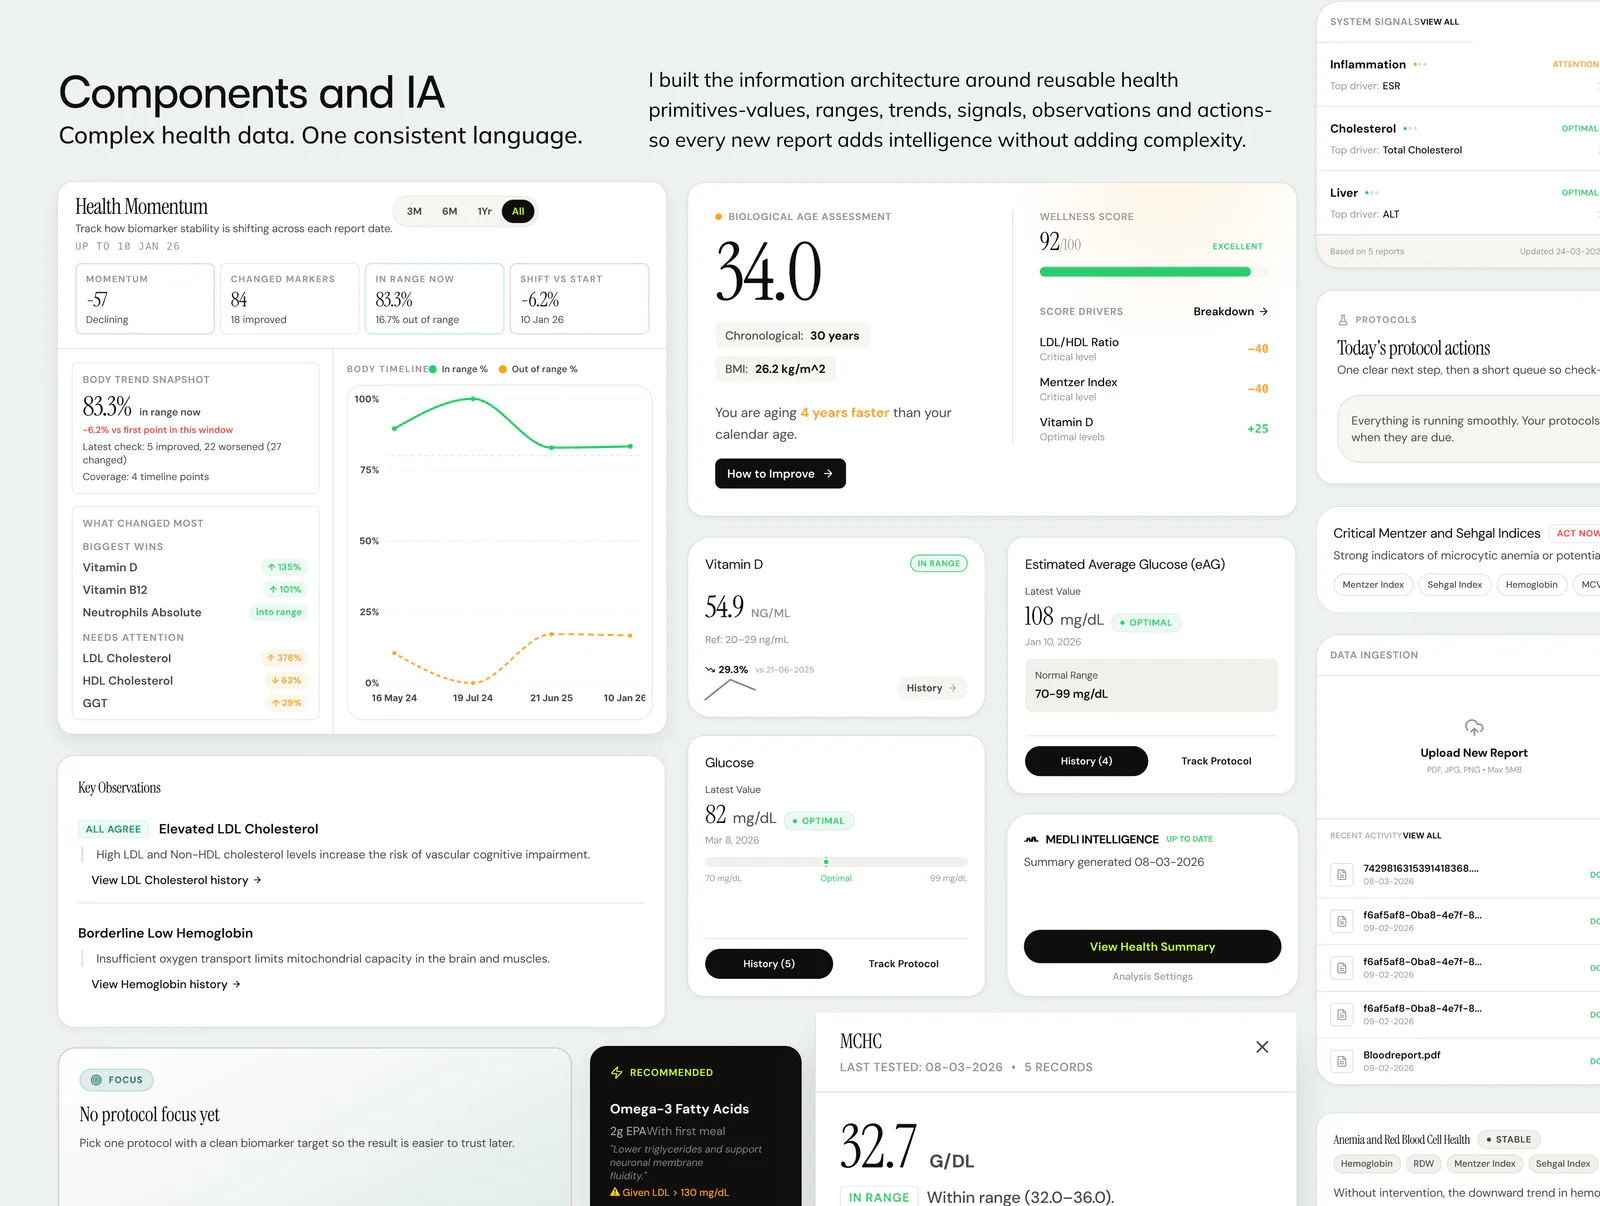
Once values are reviewed, the product groups them by biomarker and date. The timeline separates the original measurement from the reference range attached to that report, because ranges and units may vary between providers.
The overview helps someone move from a broad health picture into a specific marker without losing time context. The source report remains reachable whenever a detail needs to be checked.
05 / Trend explanation
Explain the change without pretending to diagnose it
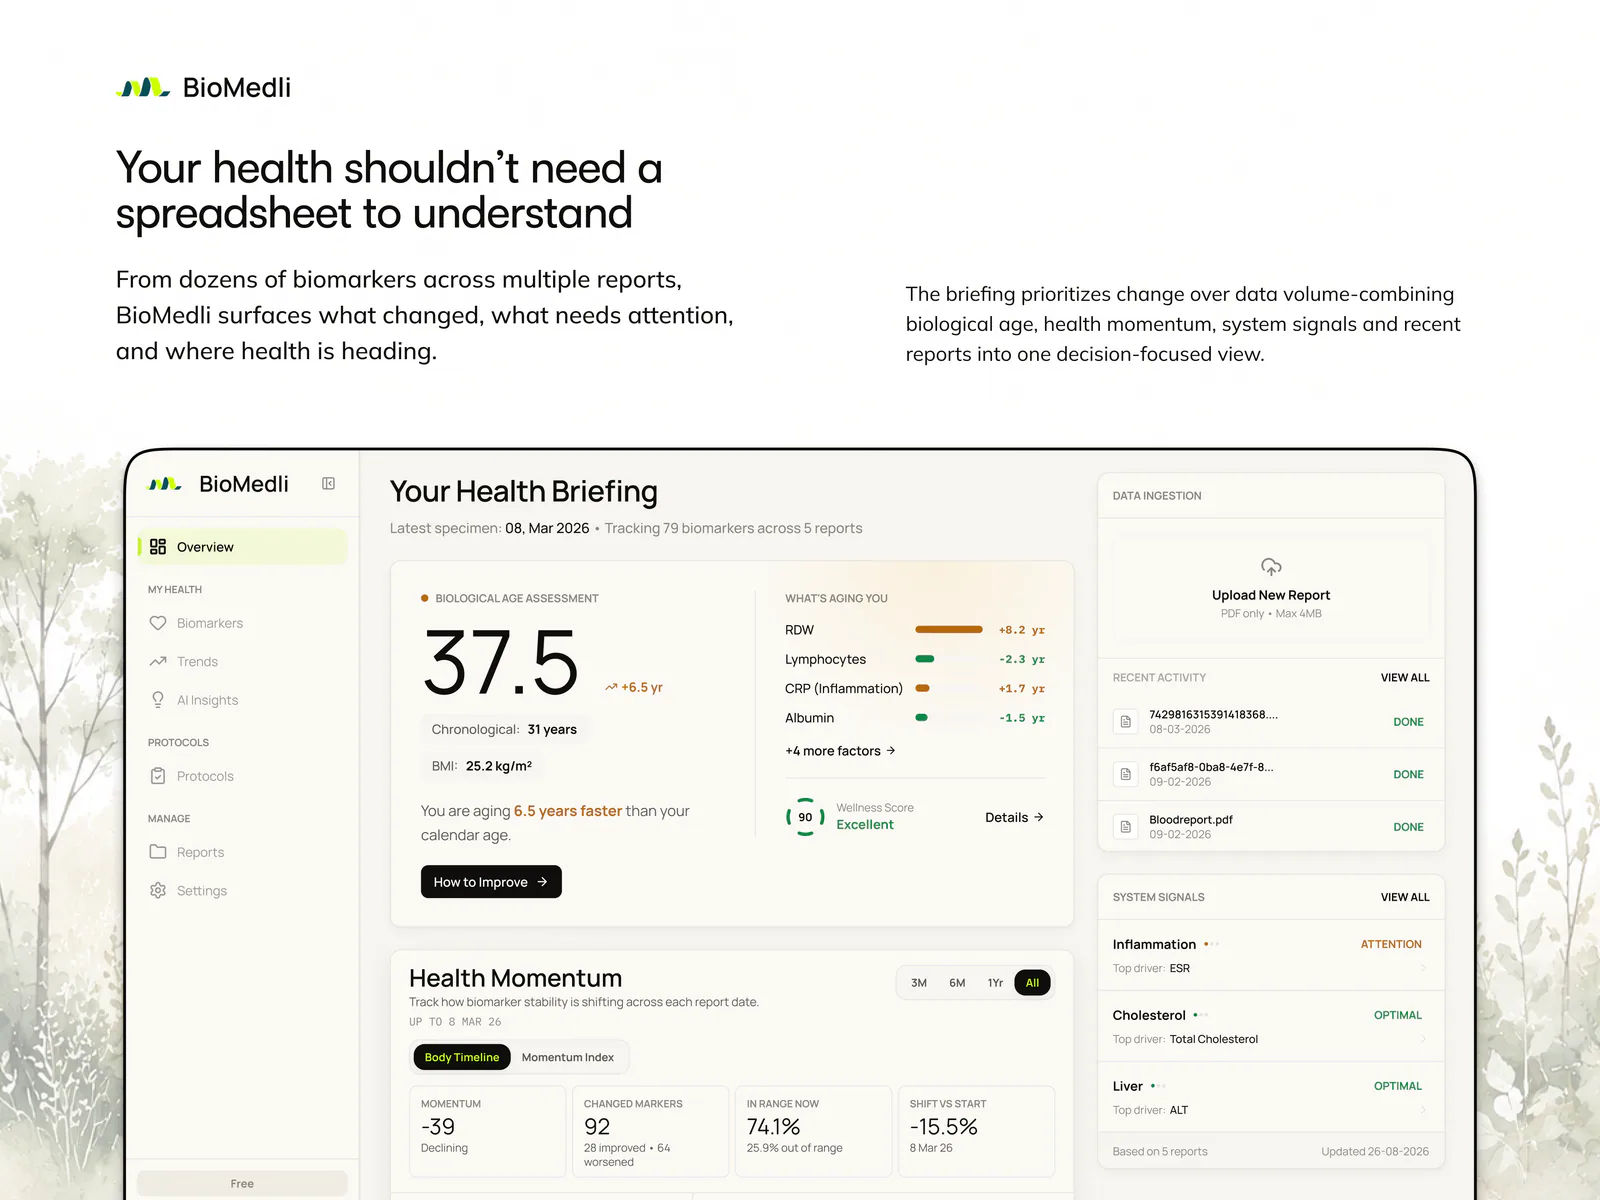
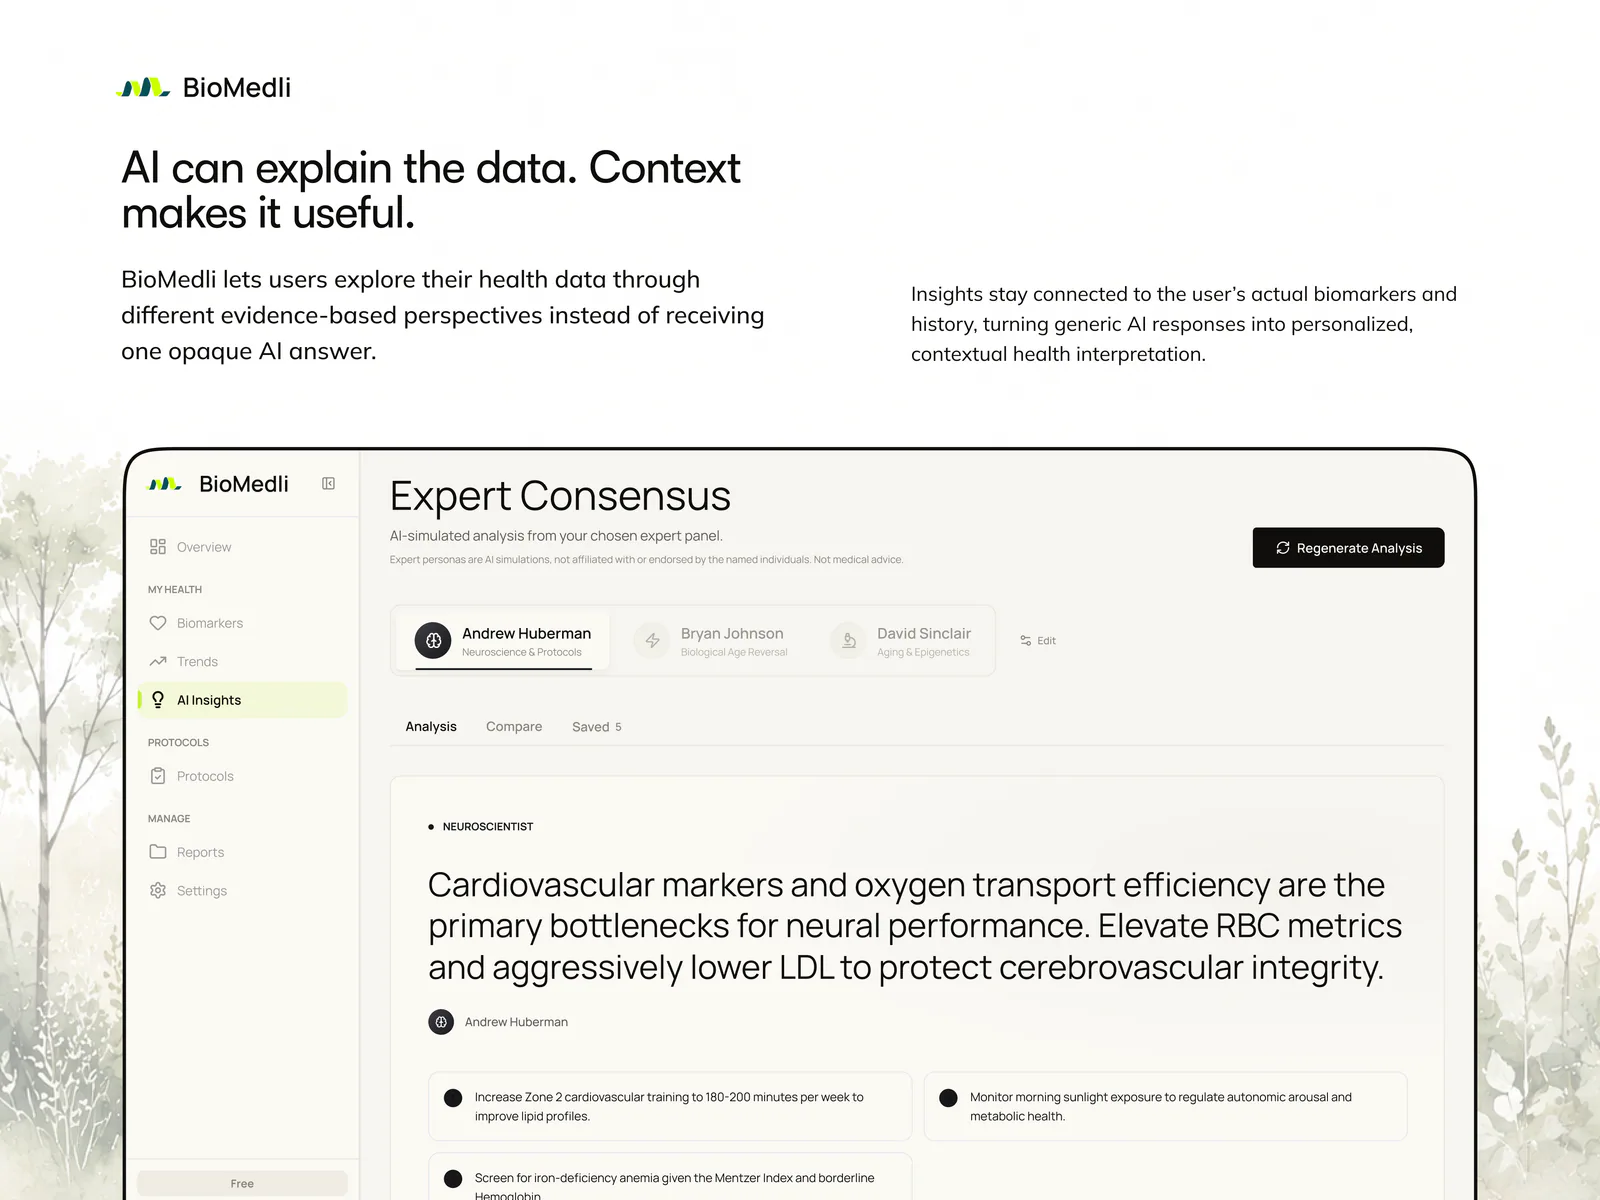
A chart can show direction while still leaving important context unknown. Explanations distinguish the measured pattern from general educational information. They avoid implying a condition or treatment and make clear when a clinician is the appropriate next source of guidance.
The briefing is generated around reviewed results rather than an unconstrained prompt. This gives the model a defined task and gives the person a clearer basis for judging the response.
| Layer | What it contains | What it must not imply |
|---|---|---|
| Record | The reviewed value, unit, date and source | That extraction is infallible |
| Pattern | Direction and comparison across available dates | That correlation establishes a cause |
| Education | Plain-language background and possible questions | A diagnosis or individual treatment advice |
06 / Uncertainty
Uncertainty belongs in the interface
The product distinguishes a missing value, an unreadable value and a value the system extracted with low confidence. Those states require different user actions. Collapsing them into one warning would make the interface simpler and the product less trustworthy.
The same principle applies to explanations. When the available record is incomplete, the language reflects that boundary instead of filling the gap with certainty-shaped copy.
07 / User control
People can inspect, correct and remove their record
Review is supported before data enters the timeline and remains available afterwards. A person can revisit a source, correct a measurement, remove an upload or choose what to include in a generated briefing.
These controls are part of the primary experience because the data is personal and the system can be wrong. Trust comes from making those realities operable, not from hiding them behind a settings screen.
08 / Privacy and non-diagnostic boundary
Architecture supports the promise, but does not replace it
Identity, file handling and model-facing information are separated so the product can minimise what is passed through each part of the workflow. The public case study keeps architecture subordinate to the user promise: a person should know what they uploaded, what the system is doing and what remains in their control.
Product language consistently states that the experience is educational and non-diagnostic. Final privacy and medical wording must remain subject to client and specialist review before release.
09 / Delivery and evidence
Carry the design decision into the working product
The engagement connected product thinking, interface design and implementation so extraction behaviour and interface states could evolve together. That continuity reduced the distance between a Figma decision and the real response of the product.
The earlier public story includes commercial and performance statements. They are not published in this version while the underlying records and permissions are awaiting review. The case study documents the product model and delivered workflow without using those claims as proof.
From the working archive
More from the archive
06 frames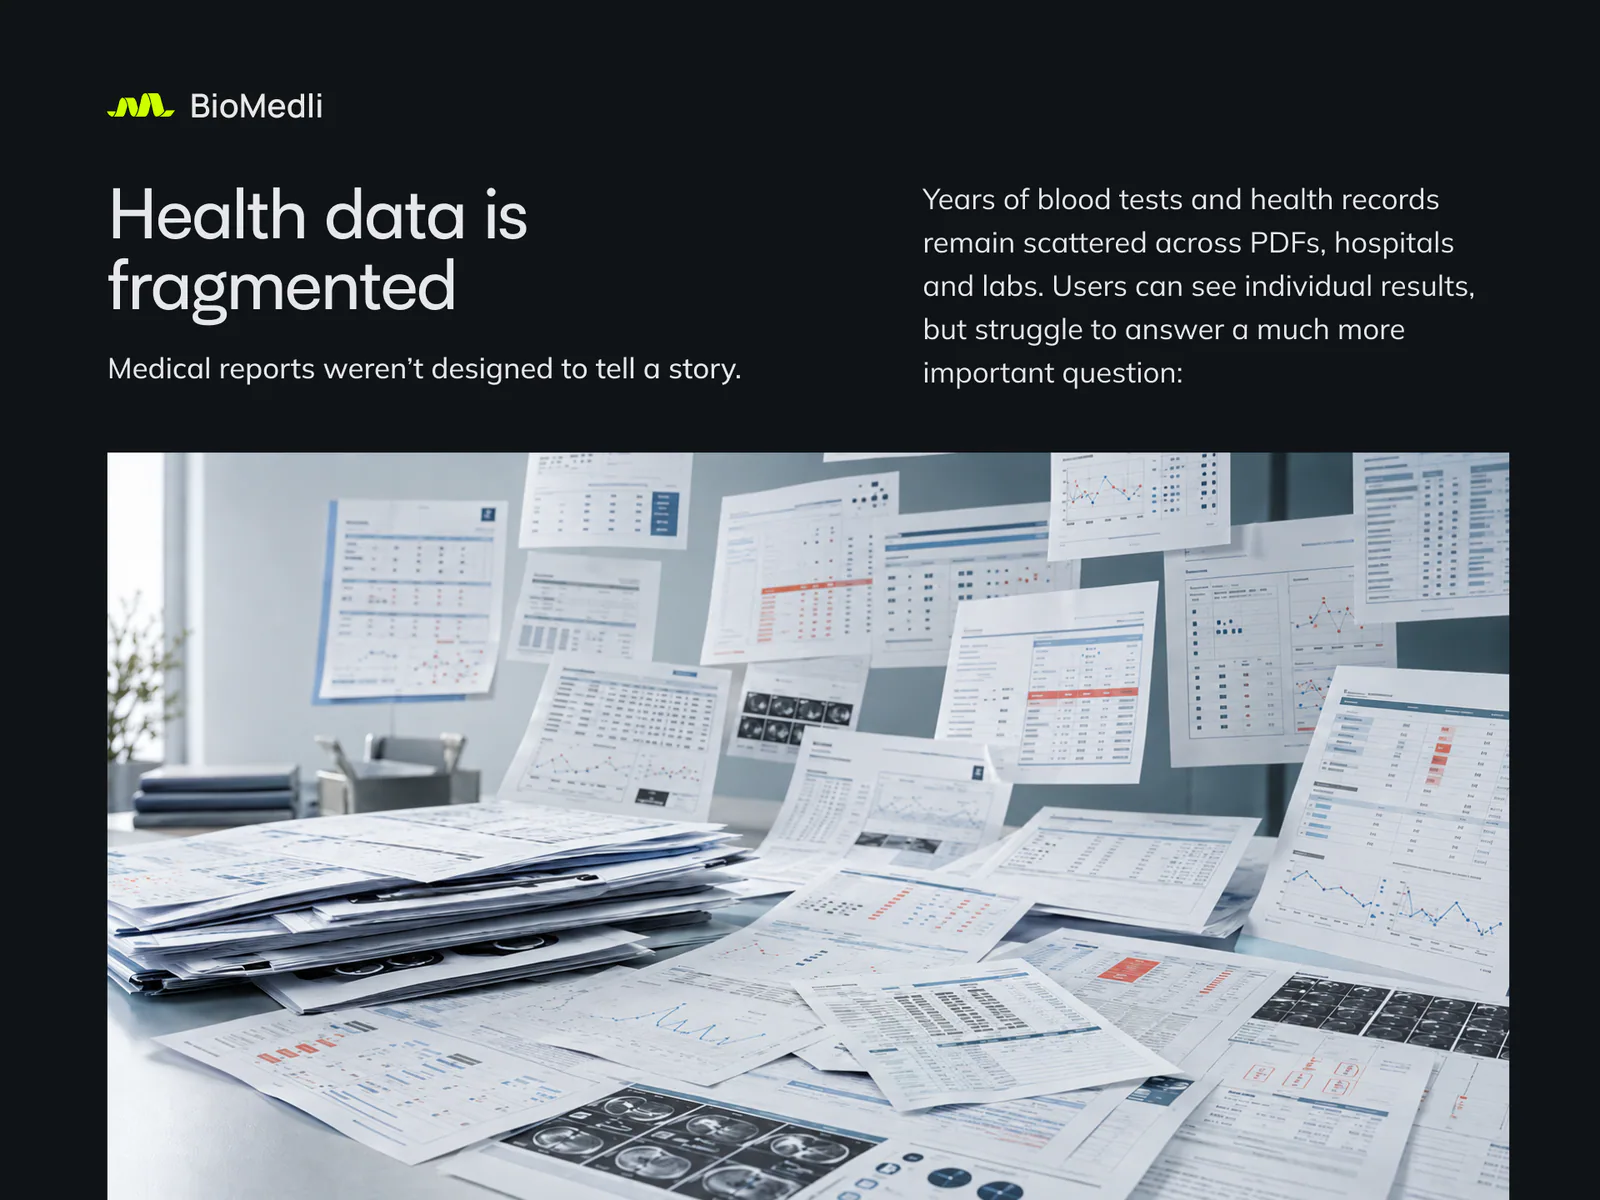
Project references